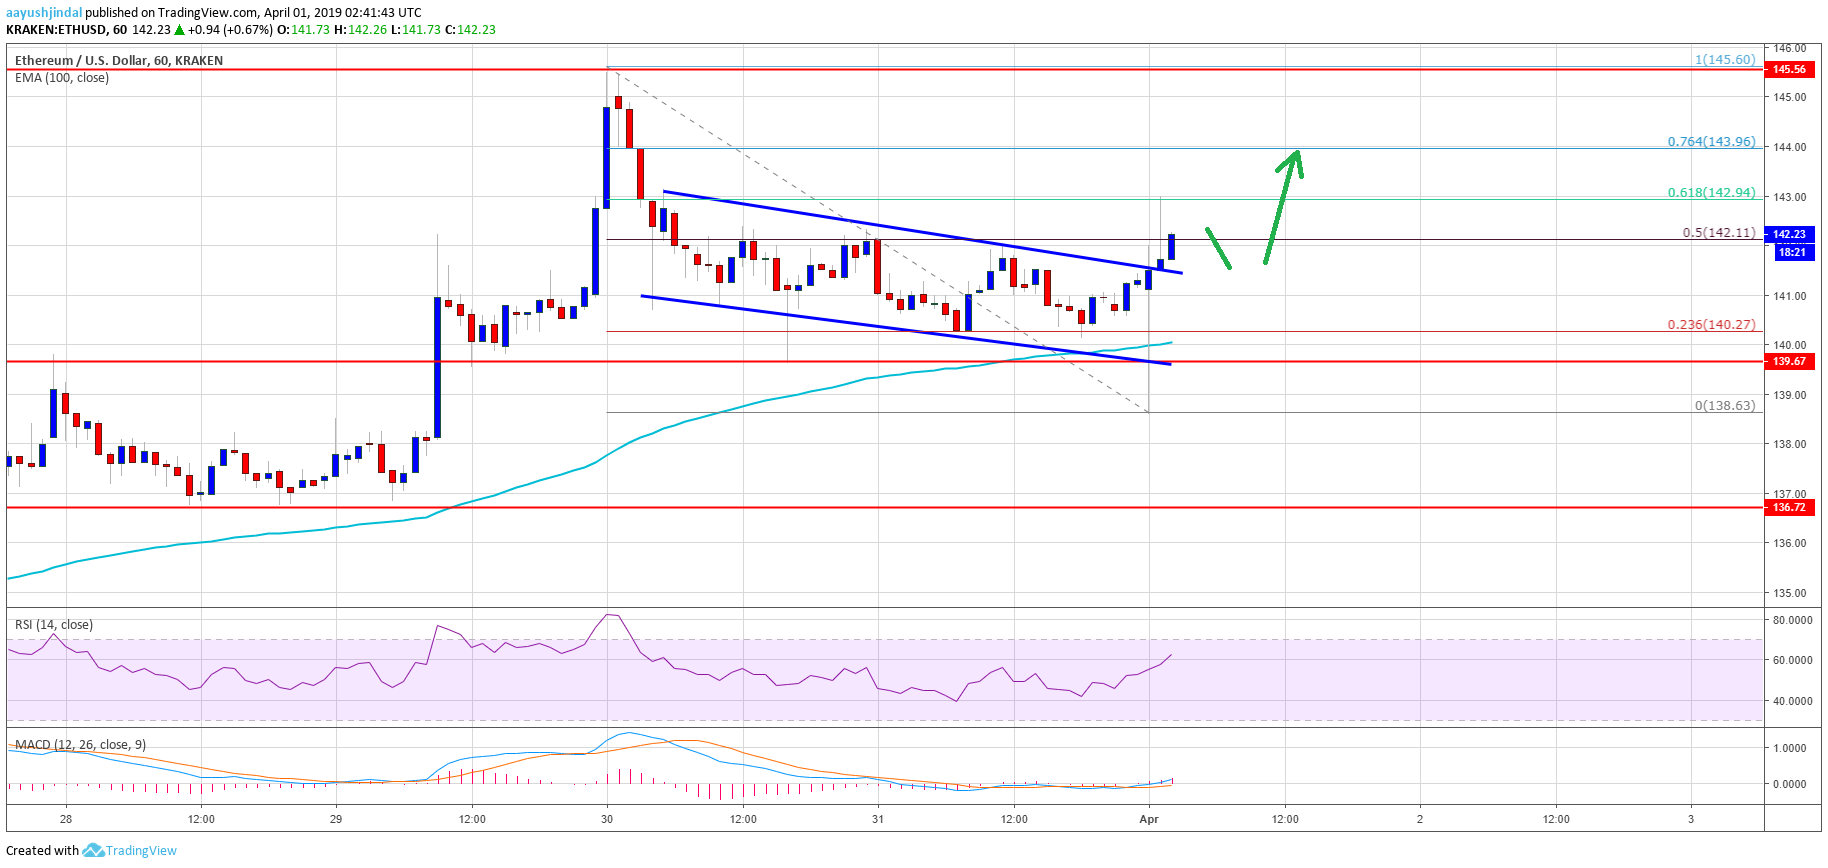
- ETH price corrected lower recently and tested the $39 support area against the US Dollar.
- The price found a strong buying interest near $139 and it recently bounced back.
- There was a break above a declining channel with resistance at $141 on the hourly chart of ETH/USD (data feed via Kraken).
- The pair is currently trading above the $142 level and it may continue to rise towards the $145 resistance.
Ethereum price stayed above important supports against the US Dollar and bitcoin. ETH is moving higher once again and it seems like bulls are eyeing a break above the $145 swing high.
Ethereum Price Analysis
Recently, ETH price started a downside correction after testing the $145-146 resistance area against the US Dollar. The ETH/USD pair corrected below the $143 and $142 levels. The price even broke the $140 support level and tested the key $139 support area. Buyers emerged near the $139 support and the 100 hourly simple moving average. After a downside spike, the price started a fresh upward move and traded above the $140 resistance level.
Later, there was a break above a declining channel with resistance at $141 on the hourly chart of ETH/USD. The pair spiked above the 50% Fib retracement level of the recent decline from the $145 swing high to $139 swing low. Ethereum price settled above the $142 level, but it faced hurdles near the $143 level. The 61.8% Fib retracement level of the recent decline from the $145 swing high to $139 swing low also acted as a resistance. At the moment, the price is currently consolidating gains above $142 and it may dip a few points.
On the downside, the $142 and $141 support levels might prevent declines. On the upside, a clear break above the $143 resistance could push the price towards the $145 resistance area. Above $145, the next target for buyers could be near the $150 level. On the downside, if there is an increase in selling pressure, the price may revisit the $139 support and the 100 hourly SMA.

Looking at the chart, Ethereum price is clearly holding key supports above the $139 level and the 100 hourly SMA. If bulls fail to defend the $139 support, the price may move into a bearish zone. The next key support is near the $137 level (the previous pivot level). Overall, as long as the price is above $139, it could continue to rise towards $145 and $150.
ETH Technical Indicators
Hourly MACD – The MACD for ETH/USD is gaining momentum in the bullish zone.
Hourly RSI – The RSI for ETH/USD is currently moving higher towards the 70 level.
Major Support Level – $139
Major Resistance Level – $143
The post Ethereum Price Analysis: ETH Bulls Eye Fresh Highs Above $145 appeared first on NewsBTC.
from NewsBTC https://ift.tt/2YFjQnD
No comments:
Post a Comment
We have received your message and would like to thank you for writing to us, we will reply by email as soon as possible.
Talk to you soon,
[Pakcoin Worker]
[Pakcoin Global]