- Ripple price traded to a new monthly high at $0.4777 and recently declined sharply against the US dollar.
- The price broke the key $0.4570 and $0.4400 support levels to enter a bearish zone.
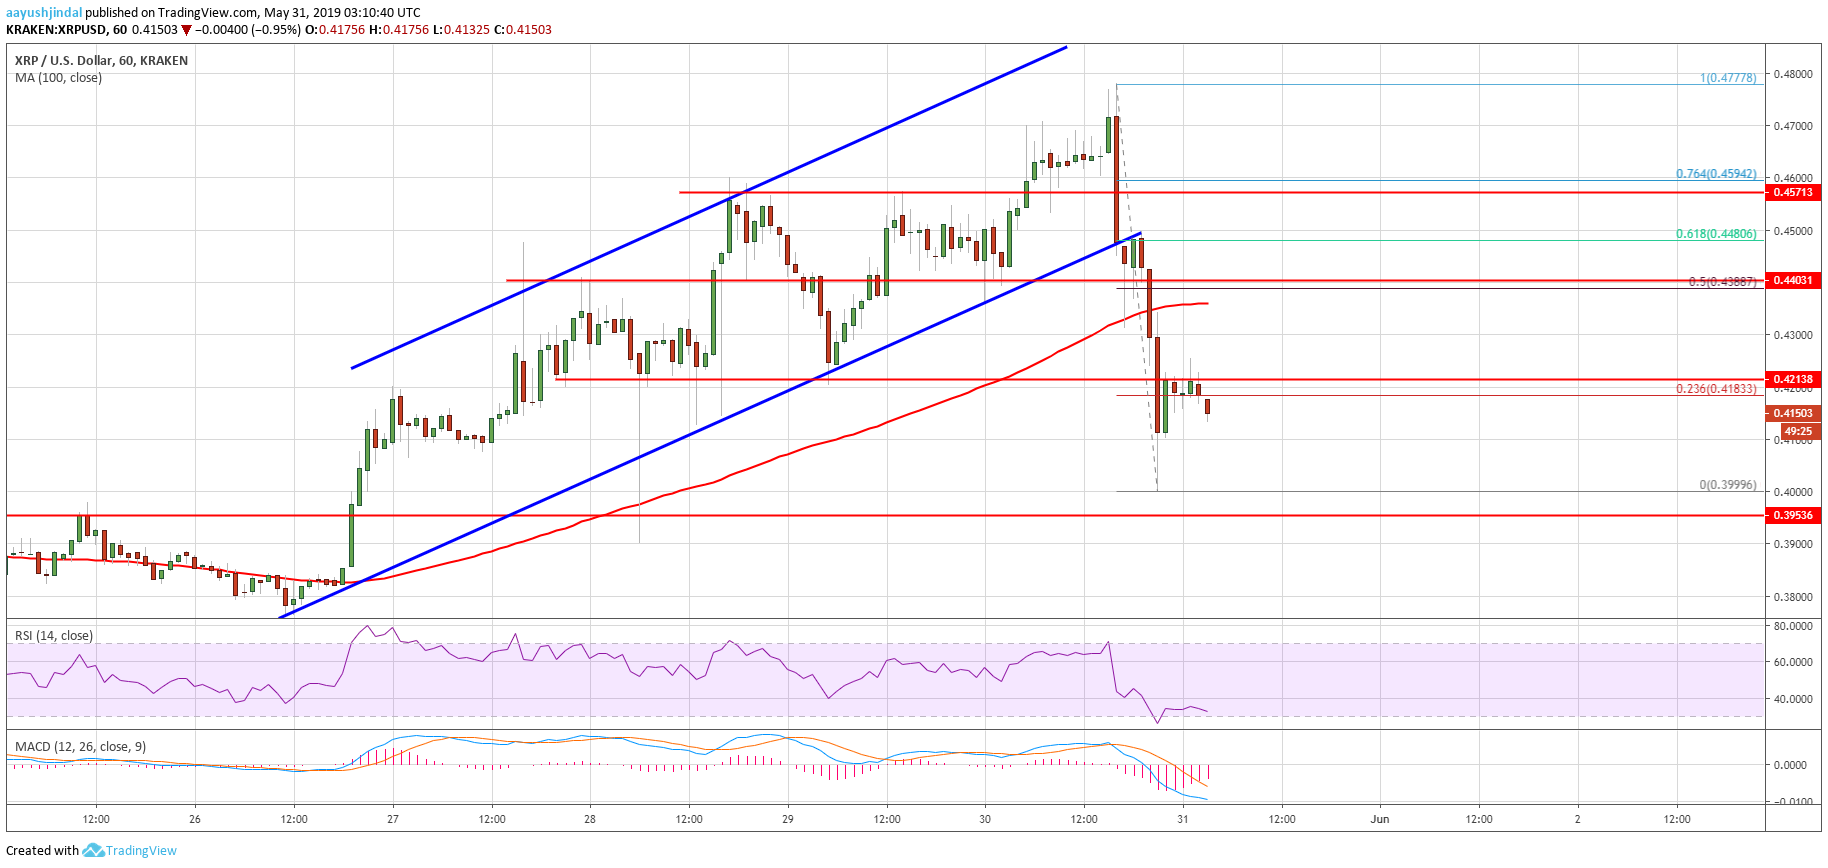
- This week’s crucial ascending channel was breached with support at $0.4500 on the hourly chart of the XRP/USD pair (data source from Kraken).
- The pair traded as low as $0.3999 and it remains at a risk of more losses in the near term.
Ripple price declined sharply against the US Dollar, similar to bitcoin. XRP broke the $0.4400 support level, tested $0.4000, and it is currently correcting towards key resistance levels.
Ripple Price Analysis
Yesterday, we saw further gains above $0.4500 in ripple price against the US Dollar. The XRP/USD pair traded above the $0.4600 resistance even climbed above the last swing high. A new monthly high was formed at $0.4777 before the price started a major downside move. It broke many important supports, starting with $0.4550 and $0.4500. There was a sharp decline below the $0.4400 support and the 100 hourly simple moving average.
More importantly, this week’s crucial ascending channel was breached with support at $0.4500 on the hourly chart of the XRP/USD pair. The pair declined below the $0.4180 and $0.4100 support levels as well. It tested the $0.4000 support area and it is currently correcting losses. There was a recovery above the $0.4100 level, and the 23.6% Fib retracement level of the recent decline from the $0.4777 high to $0.3999 low. However, the $0.4240 level is currently acting as a resistance.
On the upside, there are many resistances near the $0.4300 and $0.4400 levels. The main resistance is near $0.4400 and the 100 hourly simple moving average. To start a fresh increase, the price must break the $0.4400 resistance area. Besides, the 50% Fib retracement level of the recent decline from the $0.4777 high to $0.3999 low is also near the $0.4388 level. On the downside, an initial support is near the $0.4050 level, below which there is a risk of more declines below the $0.4000 support area.
Looking at the chart, ripple price seems to be struggling below the $0.4240 and $0.4300 levels. There could be a minor upward move, but the bulls are likely to struggle near $0.4300 or $0.4400. Therefore, as long as the price is trading below the $0.4400 level and the 100 hourly SMA, there is a risk of more downsides.
Technical Indicators
Hourly MACD – The MACD for XRP/USD is slowly reducing the recent bearish slope.
Hourly RSI (Relative Strength Index) – The RSI for XRP/USD is now well below the 40 level, with a negative angle.
Major Support Levels – $0.4100, $0.4050 and $0.4000.
Major Resistance Levels – $0.4240, $0.4300 and $0.4400.
The post Ripple (XRP) Price Crashes Below Key Support: More Losses Possible appeared first on NewsBTC.
from NewsBTC http://bit.ly/2wwOMcV
No comments:
Post a Comment
We have received your message and would like to thank you for writing to us, we will reply by email as soon as possible.
Talk to you soon,
[Pakcoin Worker]
[Pakcoin Global]