- Ripple price corrected above $0.3200, but failed to continue higher against the US dollar.
- The price tested the $0.3240 area and recently started a fresh decline below $0.3200.
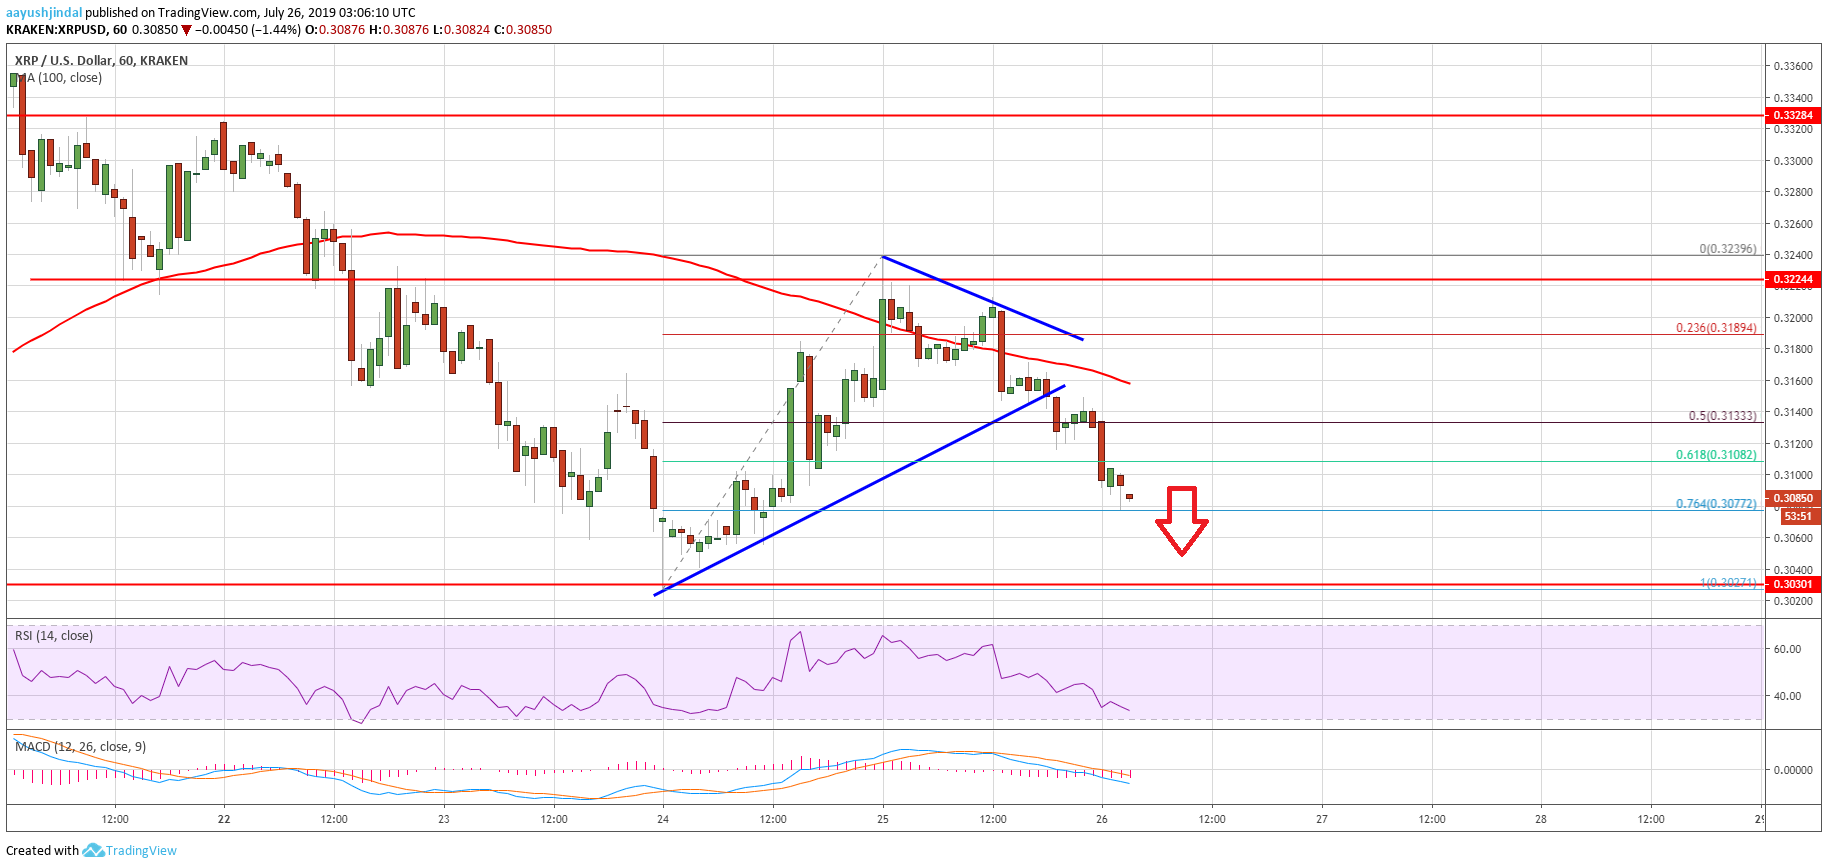
- There was a break below a contracting triangle with support near $0.3160 on the hourly chart of the XRP/USD pair (data source from Kraken).
- The price is currently under pressure and it might decline further below $0.3080.
Ripple price is likely back in a bearish zone against the US Dollar and bitcoin. XRP price is again at a risk of more losses below the $0.3030 support zone in the near term.
Ripple Price Analysis
Yesterday, there was a short term upside correction in ripple price above the $0.3150 resistance against the US Dollar. The XRP/USD pair even broke the $0.3200 resistance level and the 100 hourly simple moving average. However, the pair struggled to gain momentum above $0.3230 and topped just below the $0.3240 level. A swing high was formed at $0.3239 and the price recently declined below $0.3200.
Moreover, there was a break below the 50% Fib retracement level of the upward move from the $0.3027 low to $0.3239 high. The price is now trading well below the $0.3200 level and the 100 hourly simple moving average. Additionally, there was a break below a contracting triangle with support near $0.3160 on the hourly chart of the XRP/USD pair.
The pair is now trading just above the $0.3080 support plus the 76.4% Fib retracement level of the upward move from the $0.3027 low to $0.3239 high. If there are more downsides, the price could even break the $0.3050 support level. Besides, there is a risk of a downside break below the $0.3030 and $0.3020 support levels in the coming sessions. In the mentioned case, the price might test the $0.2980 support area.
On the other hand, if there is an upside correction, the price could struggle to surpass the $0.3150 resistance. Moreover, the 100 hourly simple moving average is also near the $0.3160 level to act as a hurdle. The main resistance is near the $0.3200 level, above which there are chances of more upsides above $0.3240.
Looking at the chart, ripple price is likely back in a bearish zone below the $0.3200 and $0.3150 support levels. Therefore, there are chances of more losses below the $0.3080 and $0.3050 supports. If the bears remain in action, we may even witness a new weekly low below $0.2980.
Technical Indicators
Hourly MACD – The MACD for XRP/USD is currently losing pace in the bearish zone.
Hourly RSI (Relative Strength Index) – The RSI for XRP/USD is currently below 40 and might recover.
Major Support Levels – $0.3080, $0.3050 and $0.3020.
Major Resistance Levels – $0.3150, $0.3160 and $0.3200.
The post Ripple Price (XRP) Signaling Another Failed Upside, Down 4% appeared first on NewsBTC.
from NewsBTC https://ift.tt/2LH8lcc
No comments:
Post a Comment
We have received your message and would like to thank you for writing to us, we will reply by email as soon as possible.
Talk to you soon,
[Pakcoin Worker]
[Pakcoin Global]