- Ripple price is struggling to climb higher above the $0.2750 and $0.2800 resistances against the US dollar.
- Bitcoin price failed to climb above the key $10,500 resistance level and declined recently.
- A major bullish trend line with support near $0.2670 is at risk on the hourly chart of the XRP/USD pair (data source from Kraken).
- The pair could accelerate its decline if there is a downside break below $0.2650 and $0.2620.
Ripple price is moving lower within a bearish zone against the US Dollar and bitcoin. XRP price remains at a risk of more downsides below the $0.2620 and $0.2580 supports.
Ripple Price Analysis
Yesterday, we saw a minor upward move in bitcoin, Ethereum and XRP against the US Dollar. Ripple climbed above the $0.2750 resistance and the 100 hourly simple moving average. However, the price struggled to gain traction above the $0.2800 level. As a result, the price started a fresh decline and traded below the $0.2750 support. Moreover, there was a break below the $0.2720 level and the 100 hourly simple moving average.
The price is now trading near the $0.2660 and $0.2650 support. Additionally, a major bullish trend line with support near $0.2670 is at risk on the hourly chart of the XRP/USD pair. If there is a downside break below $0.2650, the price could decline further. The next key supports are near $0.2620 and $0.2580. The recent low was formed near $0.2667 before the price attempted a recovery.
On the upside, an immediate resistance for ripple is near the $0.2700 level plus the 23.6% Fib retracement level of the recent decline from the $0.2805 high to $0.2667 low. The next key resistance is near the $0.2720 level since it coincides with the 100 hourly simple moving average. Moreover, the 50% Fib retracement level of the recent decline from the $0.2805 high to $0.2667 low is near $0.2735.
Therefore, there are a few key hurdles near the $0.2720 and $0.2740 levels. The next major resistance is near the $0.2800 level, above which the price could revisit the main $0.2900 resistance area. Conversely, if the price continues to weaken, it may even trade below the $0.2580 support.
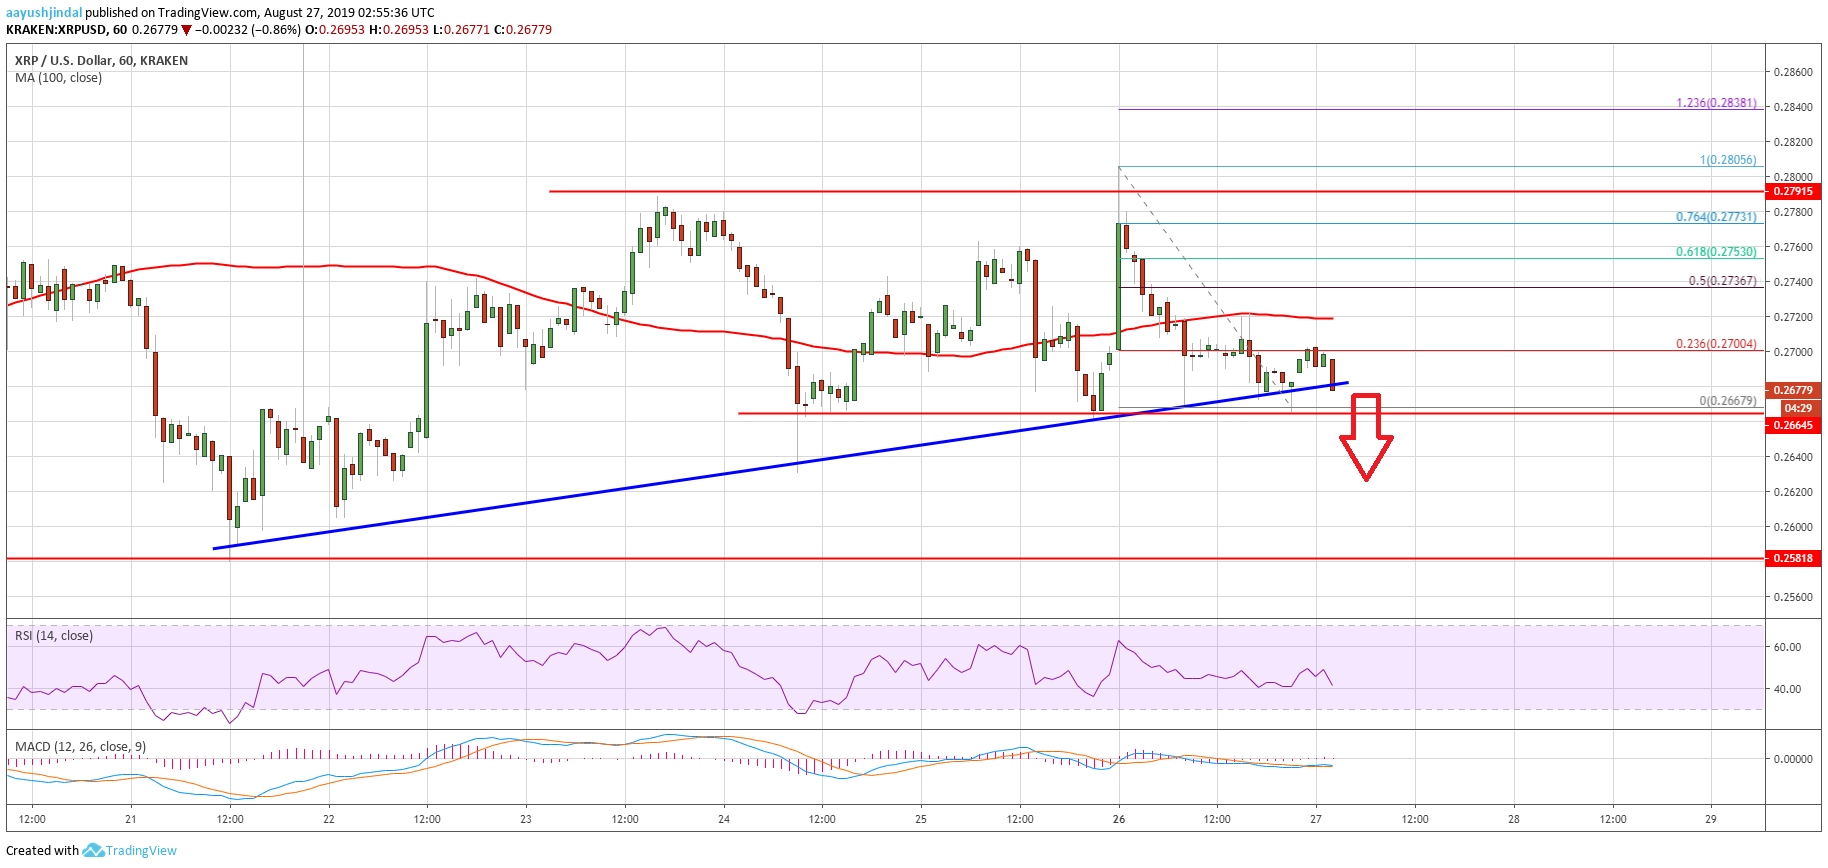
Looking at the chart, ripple price is slowly moving into a bearish zone and it may soon break the trend line and $0.2650. In the mentioned bearish case, there are high chances of a downside break below the $0.2580 support.
Technical Indicators
Hourly MACD – The MACD for XRP/USD is gaining momentum in the bearish zone.
Hourly RSI (Relative Strength Index) – The RSI for XRP/USD is now below 50 and is moving lower towards 30.
Major Support Levels – $0.2650, $0.2620 and $0.2580.
Major Resistance Levels – $0.2720, $0.2740 and $0.2800.
The post Ripple Price (XRP) At Risk Of Downside Break, Eyes $0.2500 appeared first on NewsBTC.
from NewsBTC https://ift.tt/2La1RzV

No comments:
Post a Comment
We have received your message and would like to thank you for writing to us, we will reply by email as soon as possible.
Talk to you soon,
[Pakcoin Worker]
[Pakcoin Global]