- Ethereum price declined heavily below $170 and traded close to $150 against the US Dollar.
- Bitcoin price is down more than 8% and it even traded below the key $7,500 support.
- Yesterday’s highlighted bearish trend line is intact with resistance near $165 on the hourly chart of ETH/USD (data feed via Kraken).
- The pair is currently correcting higher and it could rebound towards the $165 resistance.
Ethereum price nosedived and tested the $152 support area versus the US Dollar, while bitcoin dived 8%. ETH price could now correct higher in the short term.
Ethereum Price Analysis
In the past few days, we discussed the chances of more downsides in Ethereum below the $170 support against the US Dollar. ETH did decline recently below $170 and weakened more than 7%.
The recent decline was such that the price even broke the $160 support area. Moreover, there was a close below $165 and the 100 hourly simple moving average. Finally, the price traded close to the main $150 support area and a low was formed near $153.
More importantly, bitcoin price is down more than 8% and broke many important supports such as $7,800 and $7,500. Looking at Ethereum, the price is currently recovering and traded above the $155 level.
There was a break above the 23.6% Fib retracement level of the recent decline from the $178 high to $153 low. However, the price is facing a lot of hurdles on the upside near the $162 and $165 levels. Besides, yesterday’s highlighted bearish trend line is intact with resistance near $165 on the hourly chart of ETH/USD.
The 50% Fib retracement level of the recent decline from the $178 high to $153 low is also near the $165 level to act as a strong resistance. Therefore, Ethereum could face a strong resistance if it corrects towards the $165 area.
On the downside, the $155 and $150 levels are important supports. It won’t be easy for the bears to clear the $150 barrier. Thus, there are chances of a decent rebound in the near term above the $162 resistance.
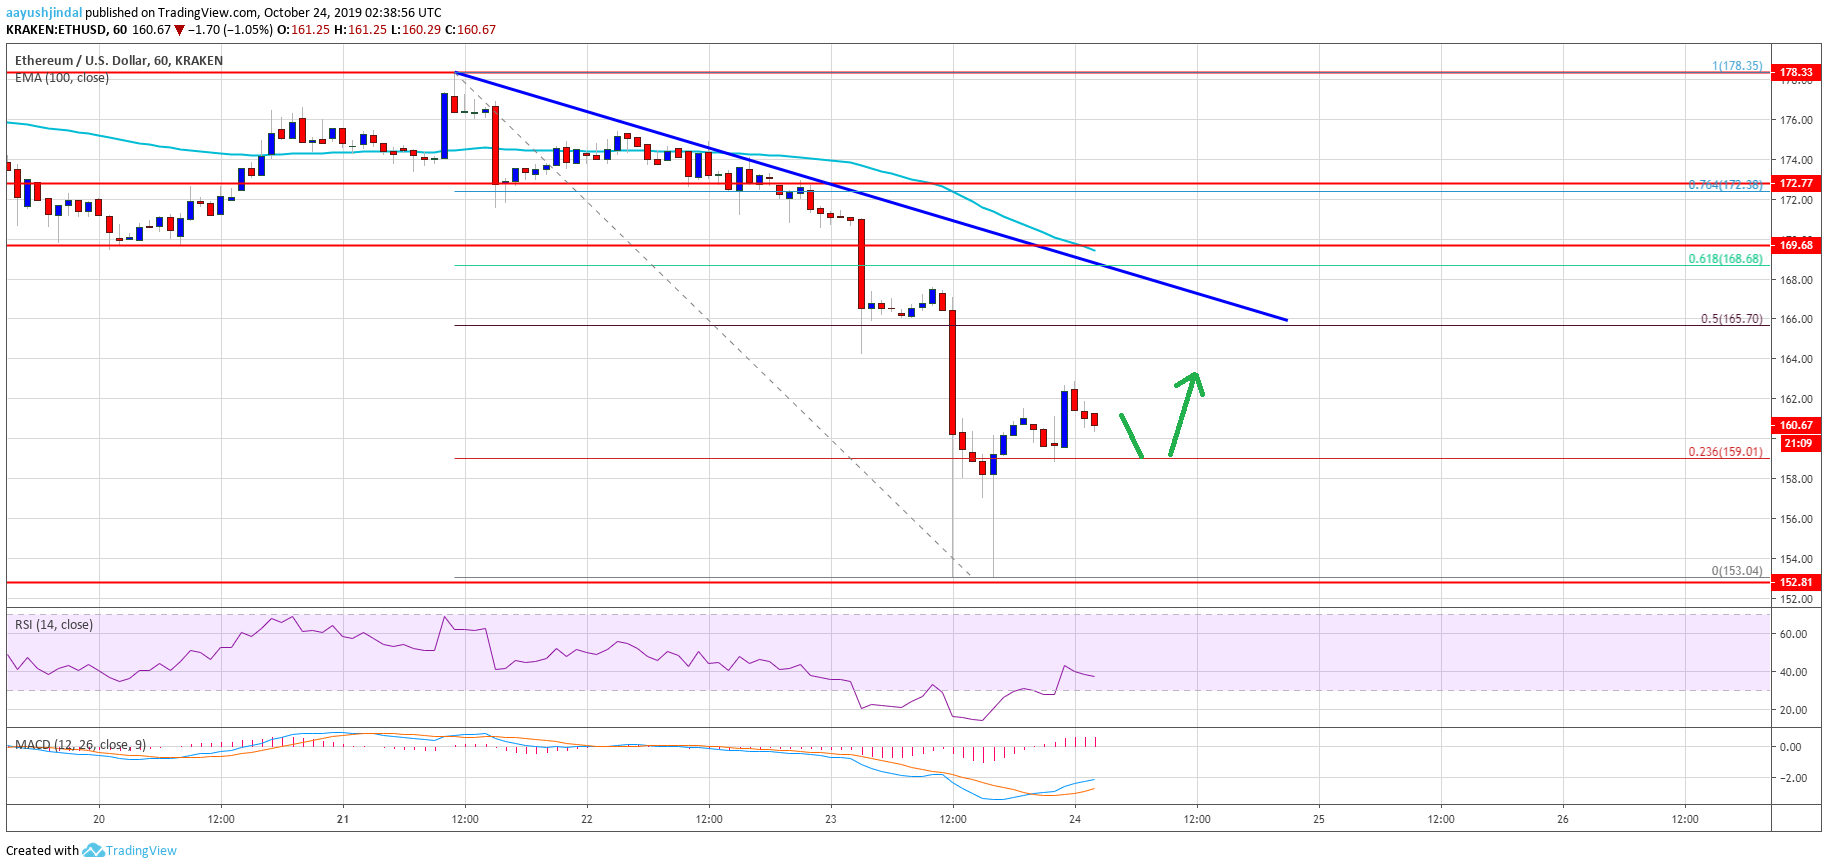
Looking at the chart, Ethereum price clearly retreated from the $152 and $150 support levels. It is showing a few positive signs above $155 and $160. Having said that, the price must recover above the $162 and $165 resistance levels to start a decent upward move. The next key resistances are near the $170 and $172 levels.
ETH Technical Indicators
Hourly MACD – The MACD for ETH/USD is now back in the bullish zone.
Hourly RSI – The RSI for ETH/USD is recovering and it is currently above the 40 level.
Major Support Level – $152
Major Resistance Level – $165
The post Ethereum (ETH) Hits All Bearish Targets, Bitcoin Down 8% appeared first on NewsBTC.
from NewsBTC https://ift.tt/32Gk9jK

No comments:
Post a Comment
We have received your message and would like to thank you for writing to us, we will reply by email as soon as possible.
Talk to you soon,
[Pakcoin Worker]
[Pakcoin Global]