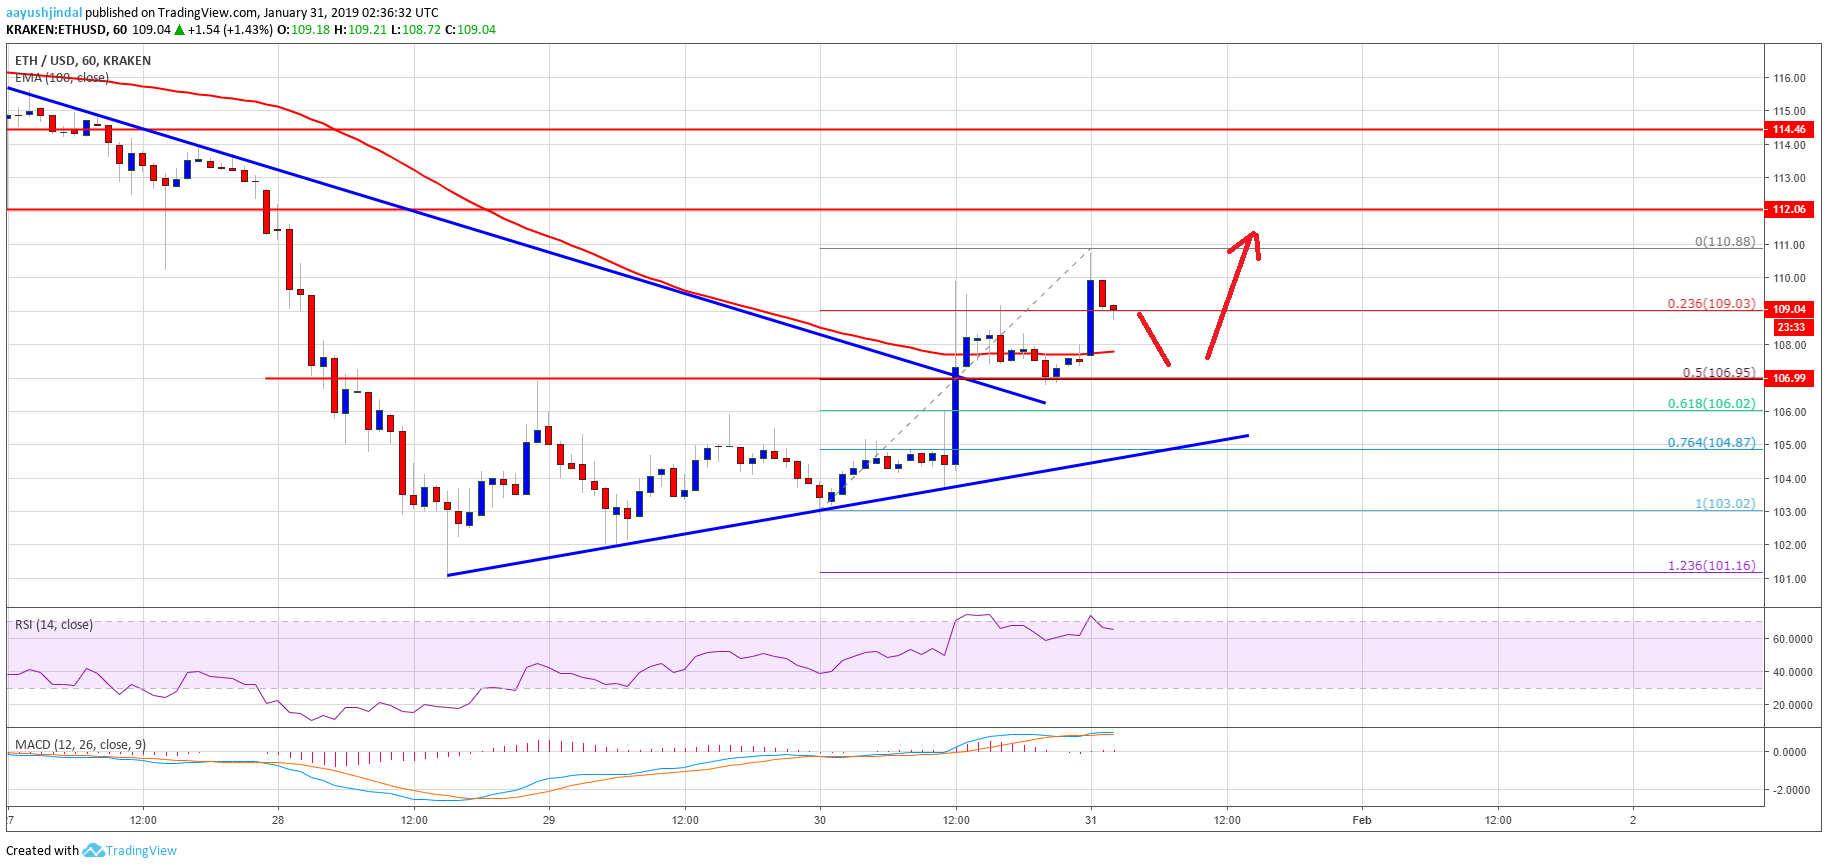
- ETH price recovered recently and broke the $105, $106 and $109 resistance levels against the US Dollar.
- Yesterday’s highlighted important bearish trend line was breached with resistance near $106 on the hourly chart of ETH/USD (data feed via Kraken).
- The pair is now placed nicely above the $106 level and it could recover towards the $113 or $114 level.
Ethereum price started a short term correction against the US Dollar and bitcoin. ETH/USD remains supported for a recovery towards the key $114 resistance level in the near term.
Ethereum Price Analysis
After trading as low as $101, ETH price started trading in a range above $103 against the US Dollar. The ETH/USD pair formed a couple of breakout patterns with resistance near the $105 and $106 levels. Finally, there was an upside move and the price broke the $106 resistance. Buyers pushed the price above the 50% Fib retracement level of the last drop from the $115 swing high to $101 swing. Moreover, the price traded above the $106 level and the 100 hourly simple moving average.
Besides, yesterday’s highlighted important bearish trend line was breached with resistance near $106 on the hourly chart of ETH/USD. The pair spiked above the $109 and $110 resistance levels and later corrected lower. It is currently testing the 23.6% Fib retracement level of the recent wave from the $103 low to $111 high. However, there are many supports on the downside near the $107 and $106 levels. More importantly, the 100 hourly simple moving average is near the $107 level. The 50% Fib retracement level of the recent wave from the $103 low to $111 high is also near $107.

Looking at the chart, ETH price may dip a few points in the short term, but it remains supported near $107 and $106. It seems like the price could recover towards the $113 and $114 resistances, where sellers are likely to emerge.
ETH Technical Indicators
Hourly MACD – The MACD for ETH/USD is about to move back in the bearish zone.
Hourly RSI – The RSI for ETH/USD is placed nicely above the 60 level, with positive signs.
Major Support Level – $107
Major Resistance Level – $114
The post Ethereum Price Analysis: ETH Bullish In Short Term Above $106 appeared first on NewsBTC.
from NewsBTC http://bit.ly/2DLswR9
No comments:
Post a Comment
We have received your message and would like to thank you for writing to us, we will reply by email as soon as possible.
Talk to you soon,
[Pakcoin Worker]
[Pakcoin Global]