- Ripple price rallied recently and broke the $0.3000, $0.3150 and $0.3250 resistances against the US dollar.
- There was a break above two bearish trend lines with resistance near $0.2920 on the hourly chart of the XRP/USD pair (data source from Kraken).
- The pair traded above the $0.3320 level and it is currently correcting gains towards the $0.3210 support.
Ripple price jumped back sharply in the bullish zone against the US Dollar and Bitcoin. XRP/USD is trading with a positive bias and dips remain supported near $0.3200.
Ripple Price Analysis
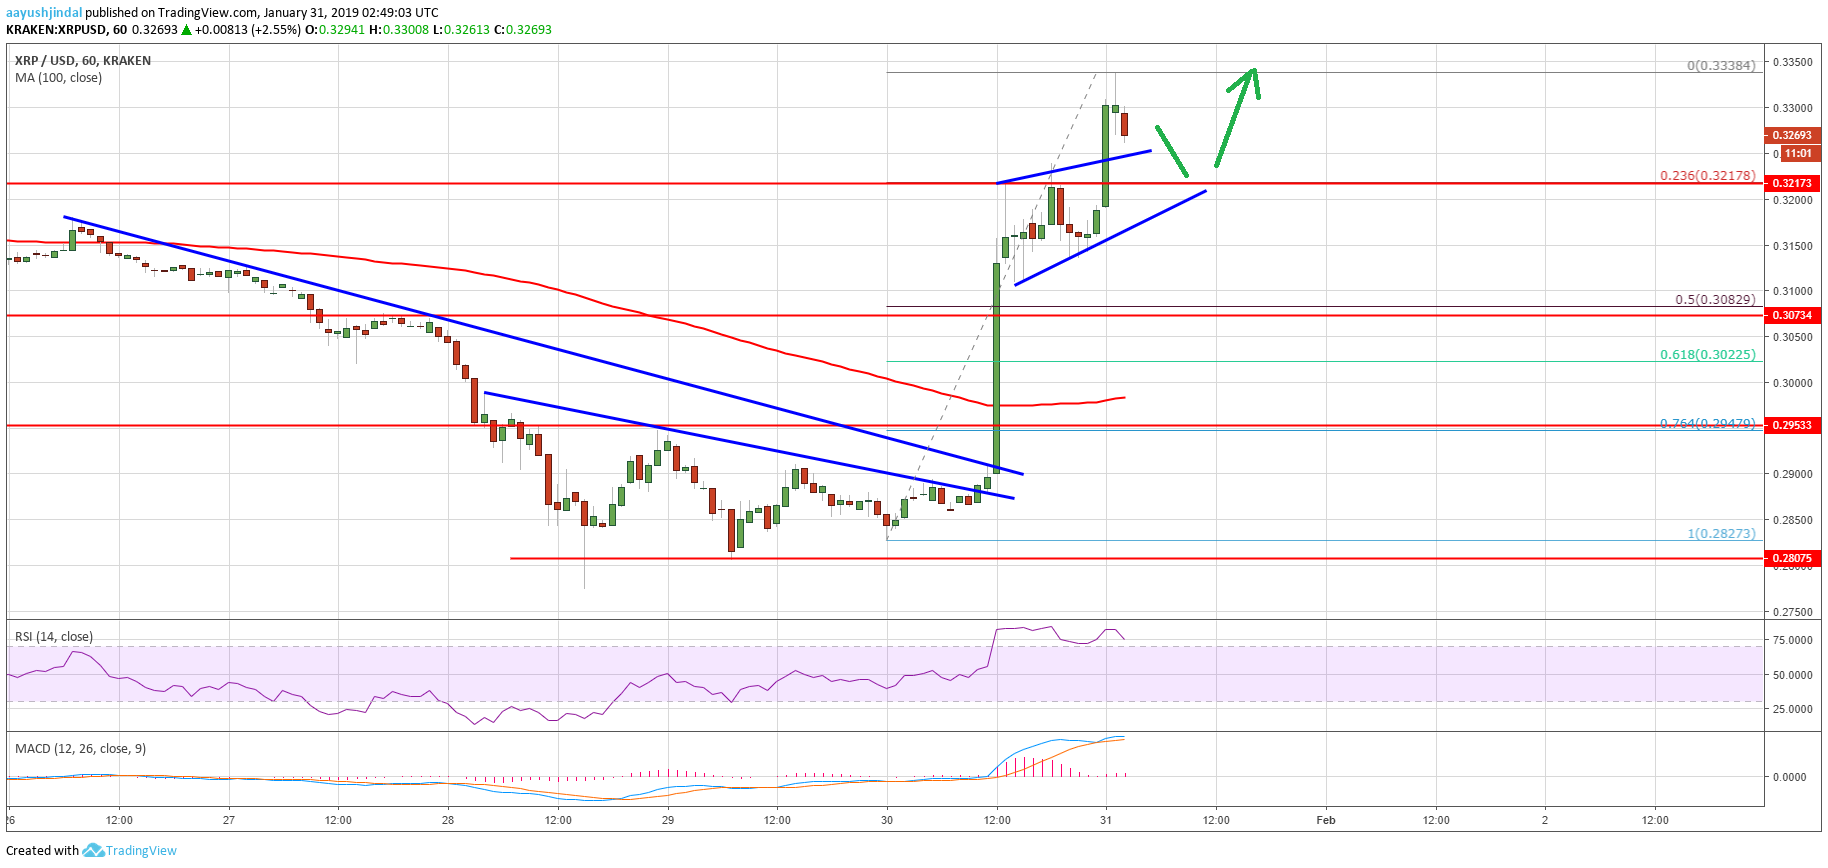
After forming a solid support base near $0.2800, ripple price started a strong recovery against the US Dollar. The XRP/USD pair rallied and broke many important resistances such as $0.3000 and $0.3150. Buyers were able to clear the 61.8% Fib retracement level of the slide from the $0.3175 high to $0.2776 low. It opened the doors for more gains and the price settled above $0.3150 plus the 100 hourly simple moving average.
More importantly, there was a break above two bearish trend lines with resistance near $0.2920 on the hourly chart of the XRP/USD pair. The pair surpassed the $0.3200 and $0.3250 resistance levels to move into a positive zone. The recent price action was positive above $0.3300 and the price formed a new weekly high at $0.3338. It is currently correcting lower towards the $0.3240 and $0.3210 supports. The 23.6% Fib retracement level of the recent wave from the $0.2827 low to $0.3338 high is near $0.3215 to act as a support. Moreover, there is a connecting bullish trend line in place with support at $0.3210 on the same chart.

Looking at the chart, ripple price is placed nicely in an uptrend above the $0.3200 and $0.3210 support levels. There could be a short term downside correction, but the price remains supported above $0.3150. On the upside, the key resistances are $0.3320, $0.3350 and $0.3420 in the near term.
Technical Indicators
Hourly MACD – The MACD for XRP/USD has reduced most of its bullish slope, signaling a downside correction.
Hourly RSI (Relative Strength Index) – The RSI for XRP/USD is currently moving lower towards the 70 level.
Major Support Level – $0.3210
Major Resistance Level – $0.3320
The post Ripple Price Analysis: XRP’s Trend Overwhelmingly Bullish Above $0.3200 appeared first on NewsBTC.
from NewsBTC http://bit.ly/2DJuzFo
No comments:
Post a Comment
We have received your message and would like to thank you for writing to us, we will reply by email as soon as possible.
Talk to you soon,
[Pakcoin Worker]
[Pakcoin Global]